Monitor Azure VMware Solution with Azure Data Explorer and Grafana
Overview
As you deploy Azure VMware Subscription for your production workload, you will need to monitor the health of your environment. In Azure Well-Architected Framework, this activity is an important part of the Operational excellence pillar.
Azure VMware Solution provides a set of metrics and logs that you can use to monitor your environment. In this article, we will see how to collect and visualize these metrics and logs using Azure Data Explorer and Grafana.
Other resources about Azure VMware Solution monitoring
Monitoring Azure VMware Solution is a vast topic. This article will focus on forwarding to Azure Data Explorer and visualize through Grafana, metrics that are available out of the box.
If you want to go further, I recommend you to read the following articles:
- Monitoring your private cloud
- Azure VMware Solution metrics
- Cloud Adoption Framework for Azure: Manage Azure VMware Solution
- Cloud Adoption Framework for Azure: Management and monitoring for Azure VMware Solution enterprise-scale scenario
- Configure VMware syslogs for Azure VMware Solution
- Azure VMware Solution Advanced Monitoring (with Telegraf)
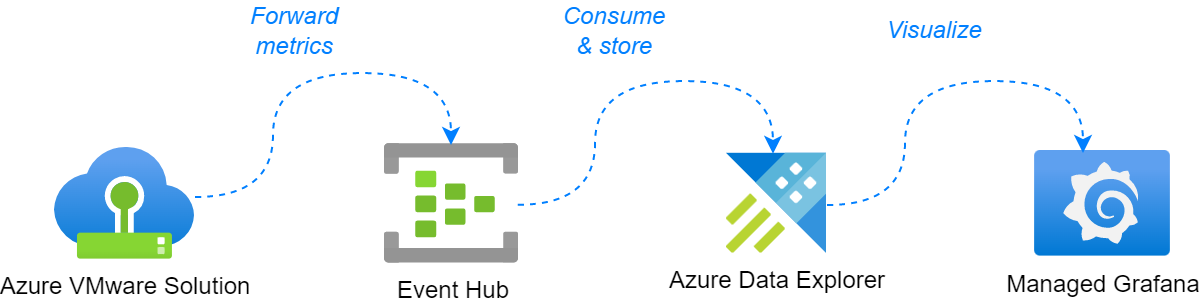
From AVS to Grafana with Azure Data Explorer
Azure VMware Solution provides a set of metrics and logs that you can use to monitor your environment. These metrics and logs are available in the Azure portal, through Azure Monitor and are available for forwarding to multiple solutions like:
Using Azure Event Hub enables more solutions to subscribe to Azure VMware Solution metrics (and logs), like mentioned in the latest post: Azure VMware Solution integration with VMware Aria Operations for Logs Cloud service.
In this article, we will see how to consume metrics with Azure Data Explorer, then to plug a Grafana dashboard on top of it for the visualization.
To host the visualization dashboard, I have chosen the Azure Managed Grafana solution to minimize the infrastructure management. But you can also deploy Grafana on your own infrastructure or reuse an existing instance.
Prerequisites : I will not cover the deployment of Azure Event Hub, Azure Data Explorer and Grafana in this article. You can find more information about these services in the following links:
Configure Azure VMware Solution metrics to Azure Event Hub
The first step is to configure Azure VMware Solution to forward metrics to Azure Event Hub. This is done through the Azure portal, in the Azure VMware Solution resource's Diagnostic settings pane.
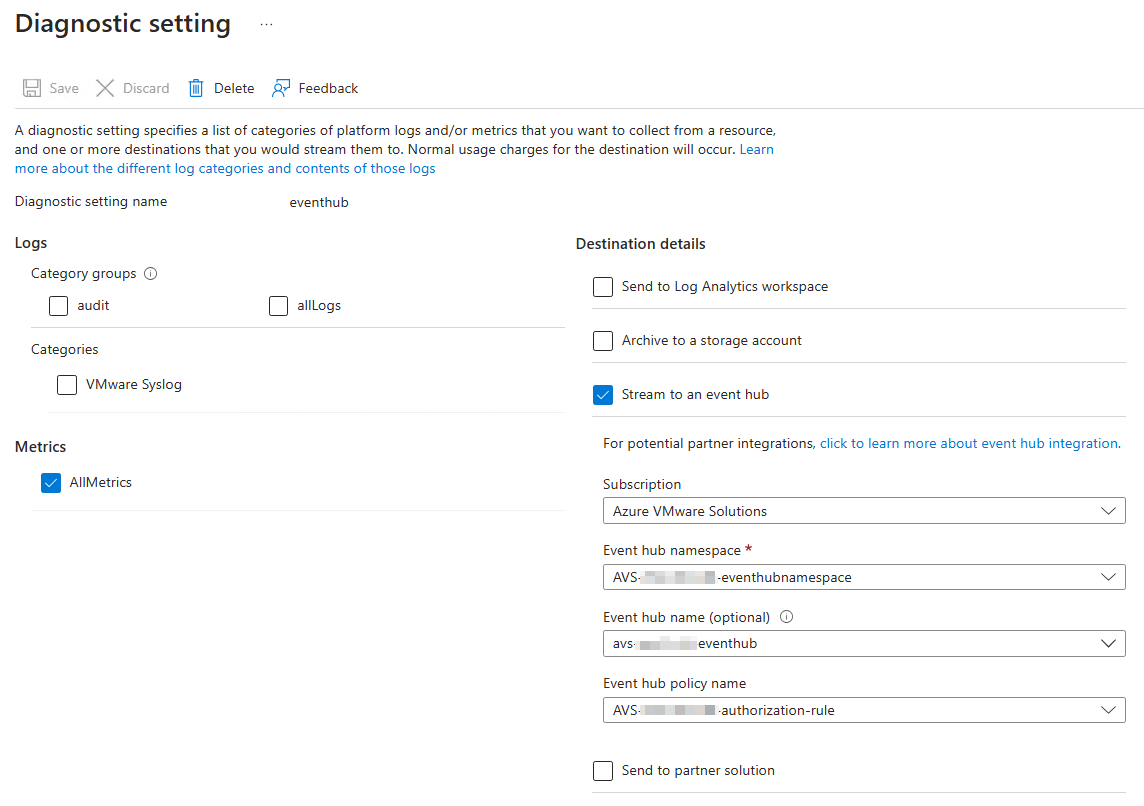
Note: By selecting only the Metrics category, you can choose to limit the number of event to send to Azure Event Hub. This is useful if you want to limit the cost of the solution. You can create multiple diagnostic settings to send different diagnostic data (logs and/or metrics) to different destinations.
Prepare Azure Data Explorer database and table
The second step is to prepare Azure Data Explorer to receive the metrics sent to Azure Event Hub by creating a database and a table to store the metrics. This is done through the Azure portal, in the Azure Data Explorer resource's Data Explorer pane or by using a kusto query (database creation can only be done through the Azure portal).
The following Kusto commands will create the table and the mapping to store the metrics sent by Azure VMware Solution to Azure Event Hub.
1// Create table command
2.create table ['avs-metrics']  (['count']:int, ['total']:long, ['minimum']:long, ['maximum']:long, ['average']:long, ['resourceId']:string, ['time']:datetime, ['metricName']:string, ['timeGrain']:string)
3
4// Ingestion Batching Policy Alter Command
5.alter table ['avs-metrics'] policy ingestionbatching @'{"MaximumBatchingTimeSpan":"00:00:30"}'
6
7// Create mapping command
8.create table ['avs-metrics'] ingestion json mapping 'avs-metrics_mapping' '[{"column":"count", "Properties":{"Path":"$[\'count\']"}},{"column":"total", "Properties":{"Path":"$[\'total\']"}},{"column":"minimum", "Properties":{"Path":"$[\'minimum\']"}},{"column":"maximum", "Properties":{"Path":"$[\'maximum\']"}},{"column":"average", "Properties":{"Path":"$[\'average\']"}},{"column":"resourceId", "Properties":{"Path":"$[\'resourceId\']"}},{"column":"time", "Properties":{"Path":"$[\'time\']"}},{"column":"metricName", "Properties":{"Path":"$[\'metricName\']"}},{"column":"timeGrain", "Properties":{"Path":"$[\'timeGrain\']"}}]'
Configure Azure Data Explorer to consume Azure Event Hub
Next step is to configure Azure Data Explorer to consume the metrics sent to Azure Event Hub. This is done through the Azure portal, in the Azure Data Explorer resource's Data connections pane.
You will need to have an existing Database and a destination table.
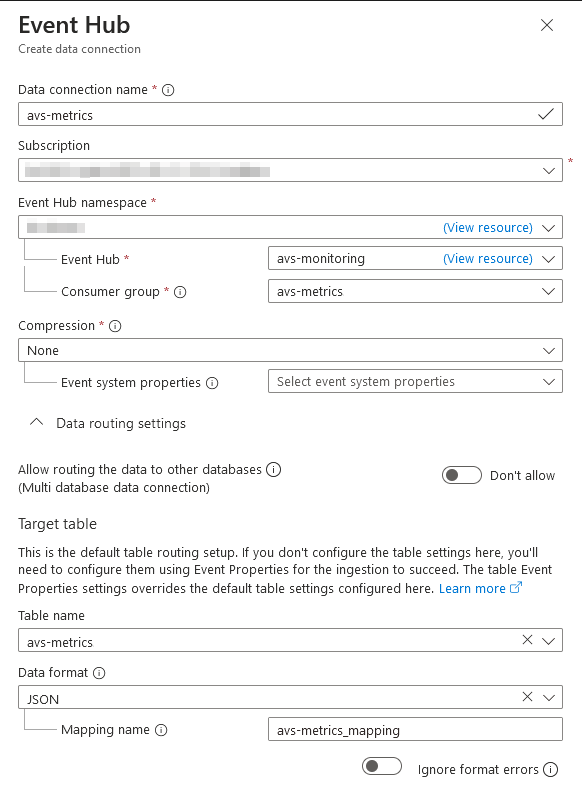
- Create a new data connection
- Select Event Hub as the data source
- Provide a name for the data connection
- Select the Azure Event Hub instance (subscription, namespace and event hub)
- Select the consumer group to use
- Select the destination table in Azure Data Explorer
- Select the format of the data: JSON
- Enter the name of the mapping to use (created in the previous step):
avs-metrics_mapping - Click on Create
After at least 5 minutes, you should see data in the destination table. You can query the data using the following Kusto query to see last items
1["avs-metrics"]
2| order by ['time'] desc
3| limit 10
You should get last values for the metrics sent by Azure VMware Solution to Azure Event Hub.
Configure Grafana to visualize Azure Data Explorer metrics
The last step is to configure Grafana to visualize the metrics stored in Azure Data Explorer.
Azure Data Explorer plugin
To consume data from Azure Data Explorer, Grafana uses the Azure Data Explorer plugin. This plugin installed by default in Azure Managed Grafana, if you are using an other kind of grafana instance you will need to install it manually.
Create an App registration for Grafana
When installed, you need to create a new data source in Grafana to connect to the Azure Data Explorer database.
First, create a new AAD application like:
1az ad sp create-for-rbac -n "Grafana2ADX"
2# Keep the appId, password and tenantId for later
Add the AAD application viewer access to your Azure Data Explorer database with the following Kusto command:
1.add database your_db_name viewers ('aadapp=your_app_client_id;your_app_tenant_id')
Create a new data source in Grafana
Configure the connection in Grafana by providing the following information:
- ADX cluster URL
- Authentication: App registration
- The AAD application ID
- The AAD tenant ID
- The AAD application secret
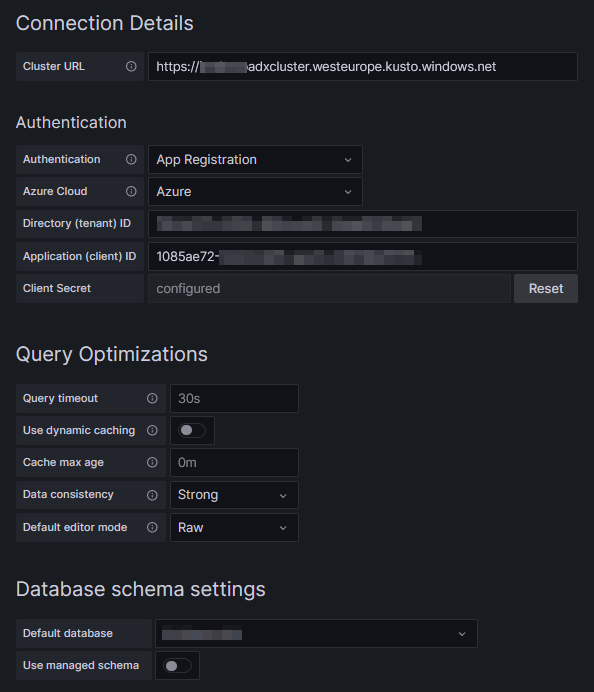
You can also select a default database if you want.
After saving the data source, you can create a new dashboard and add a new panel to visualize the metrics.
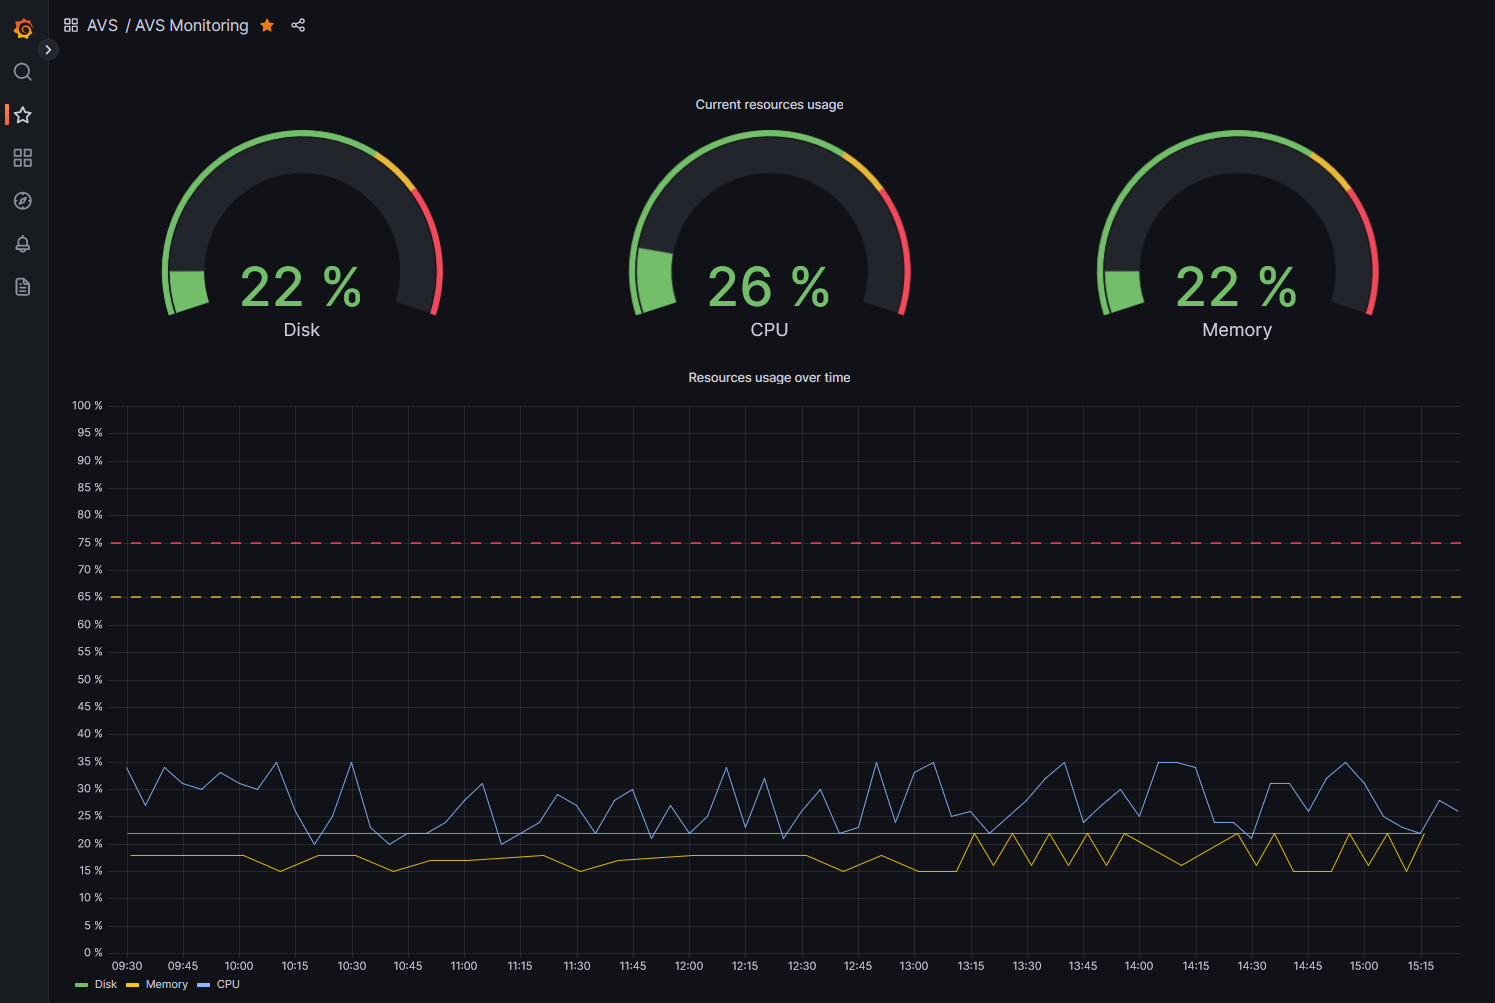
Dashboards
You are now able to explore and create visualizations for your Azure VMware Solution metrics.
For example to get the usage percentage of your vSAN datastore, you can use the following query:
1# Get disk usage percentage and rename series to "disk"
2['avs-metrics']
3| where $__timeFilter(['time']) and metricName == "DiskUsedPercentage"
4| project ['time'], Disk=average
5| order by ['time'] asc
The following metrics are available through this solution:
| Metric name | Description |
|---|---|
TotalMbAverage | Total memory in SDDC |
DiskUsedPercentage | Percent of disk usage in vSAN datastore |
UsedLatest | The total amount of disk used in the vSAN datastores |
UsageAverage | Percent of memory usage in SDDC |
EffectiveMemAverage | Total available amount of machine memory in cluster |
CapacityLatest | vSAN Datastores Total Capacity |
OverheadAverage | Host physical memory consumed by the virtualization infrastructure |
EffectiveCpuAverage | Percent of CPU usage in SDDC |
You can also use the Alerting capacity of grafana to create alerts based on these metrics and notify administrators you when specific threshold is reached (as you could also do with Azure Monitor btw).
Dashboard examples
Here are some examples of dashboards you can create with these metrics.

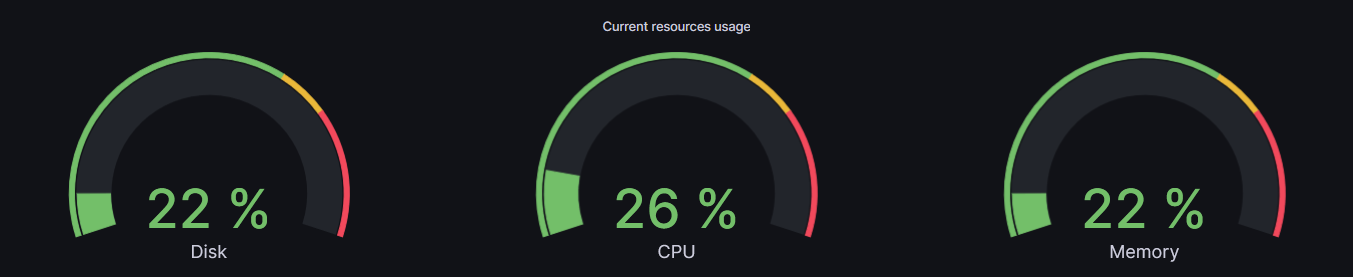
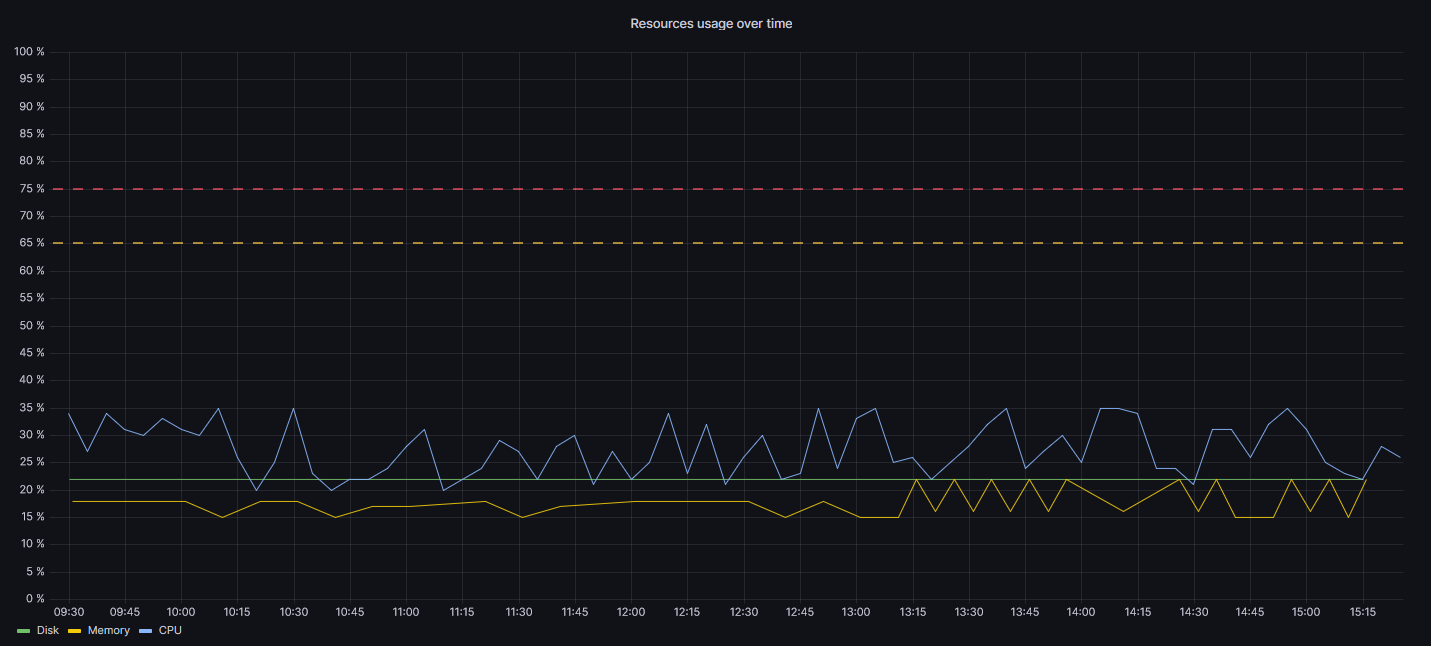
You can combine, filter and aggregate metrics to create your own dashboards and provide a global view of your Azure VMware Solution environment.